Personal Weather Station
I've been building out my home network to support the logging and visualization of more data and while that build out is underway - the weather station has arrived. This is the first of many new projects to log some data into Prometheus and visualize it with Grafana.
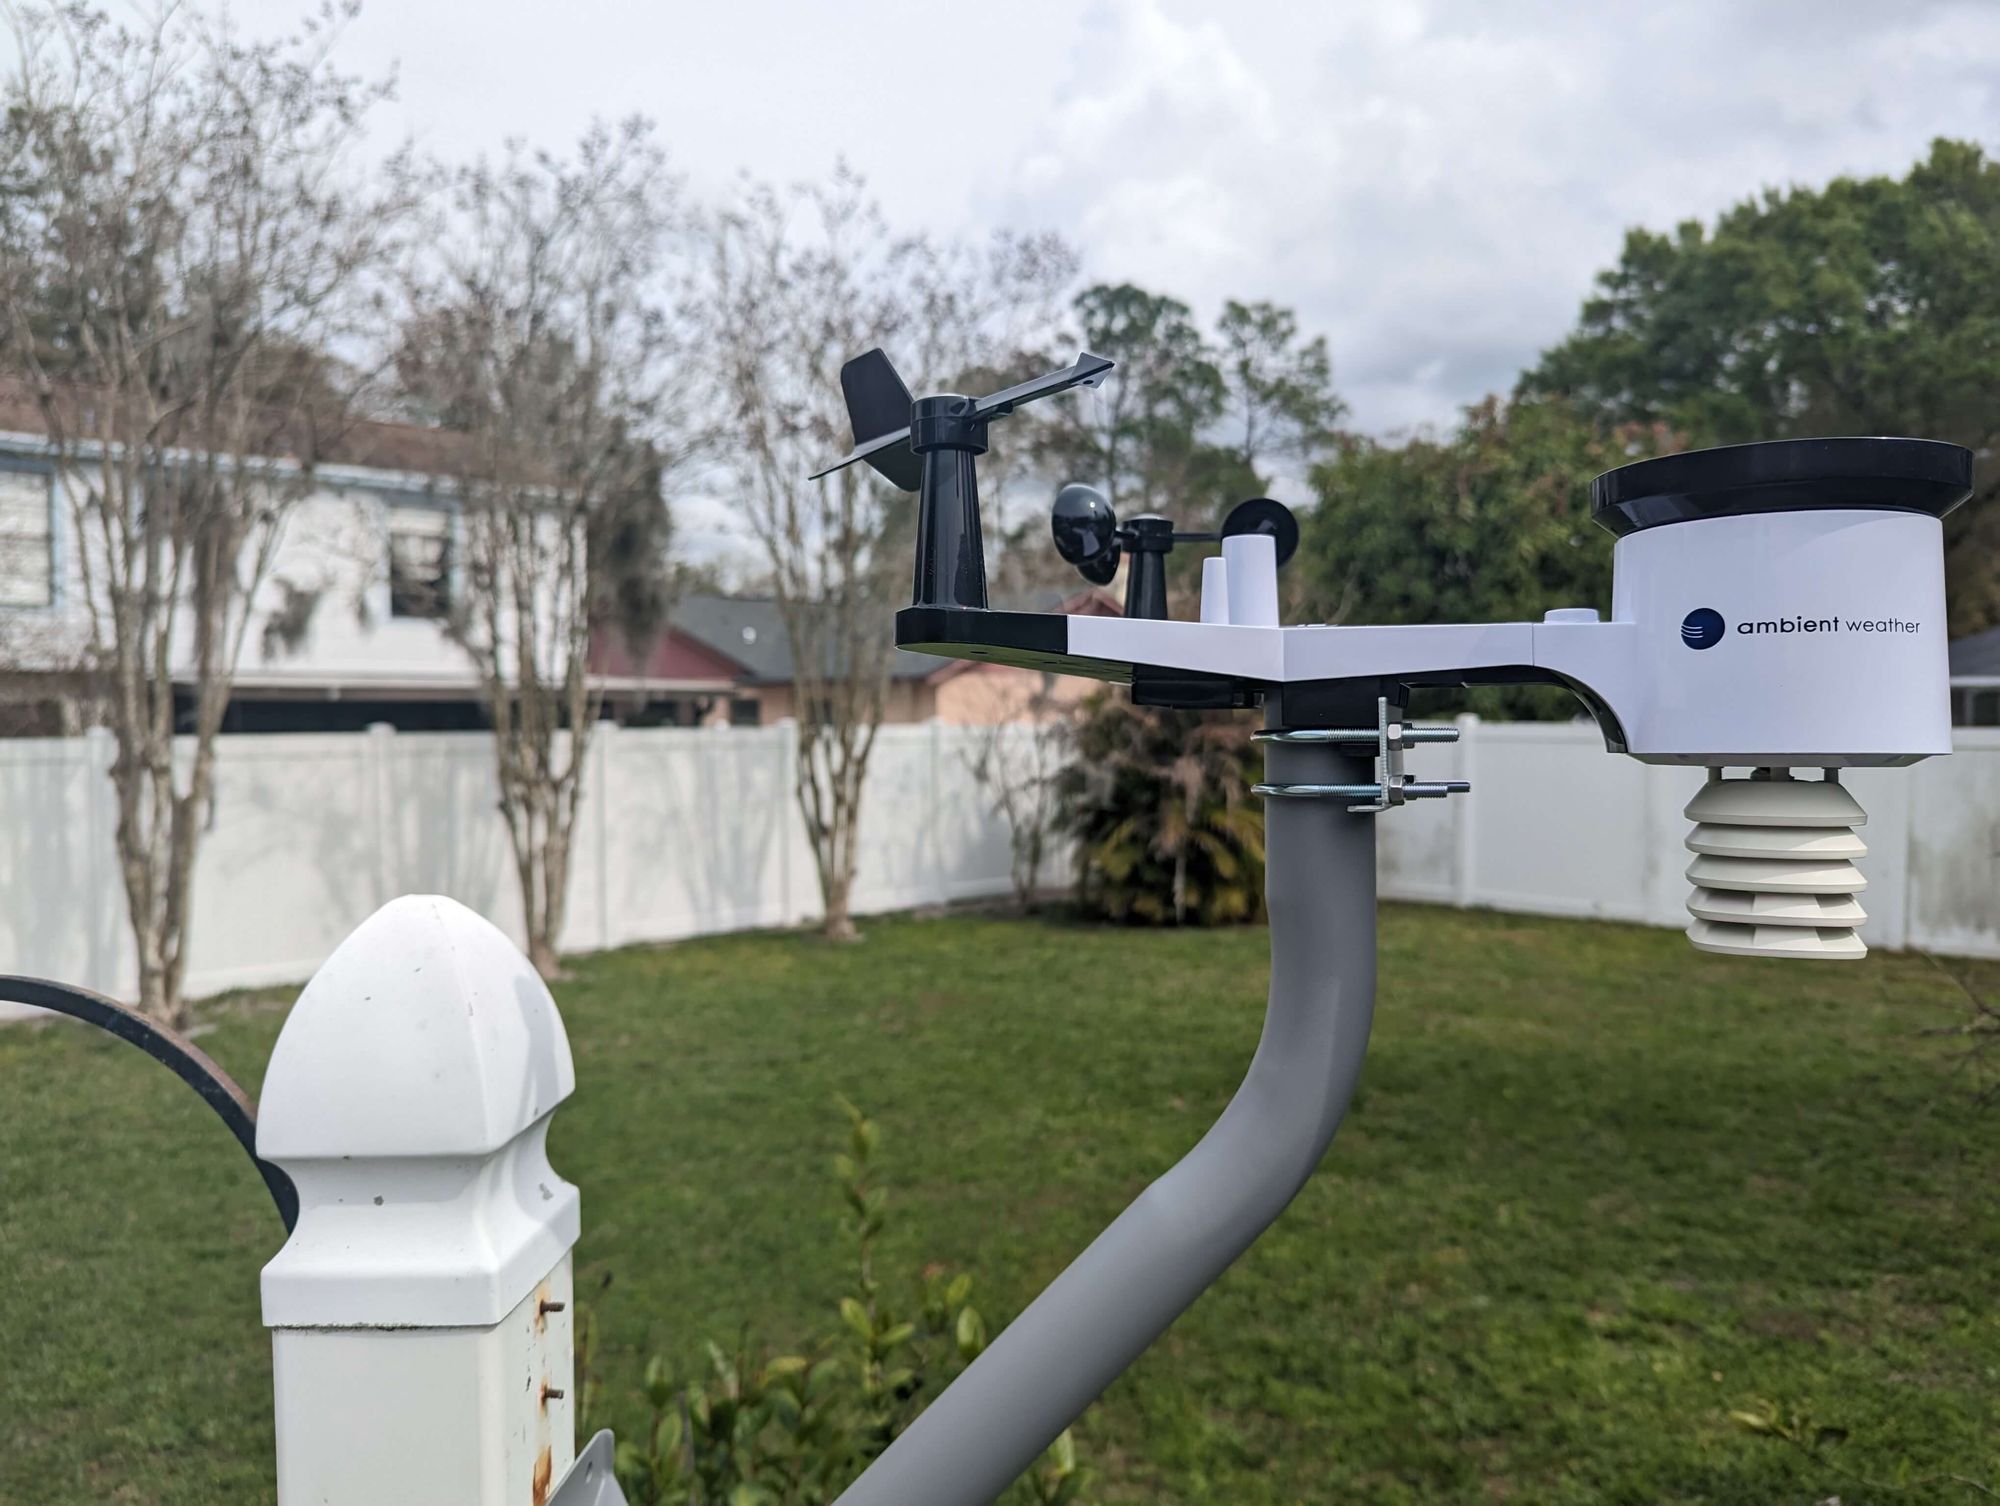
I ordered the Ambient Weather WS-2902 and mounted it outside where I once had a bird house. While its now balanced and even - the mounting job sure has its list of imperfections:
- The post is smaller than the mount bracket, so it overlaps.
- The grey color does not match with the white post.
- The old screws from the birds nest snapped in half and I left them.
- It looks odd.
All those issues aside - the process to set this up was not difficult. The device created its own wireless network that I had to connect to and once I configured my own network within it - it restarted and was connected.
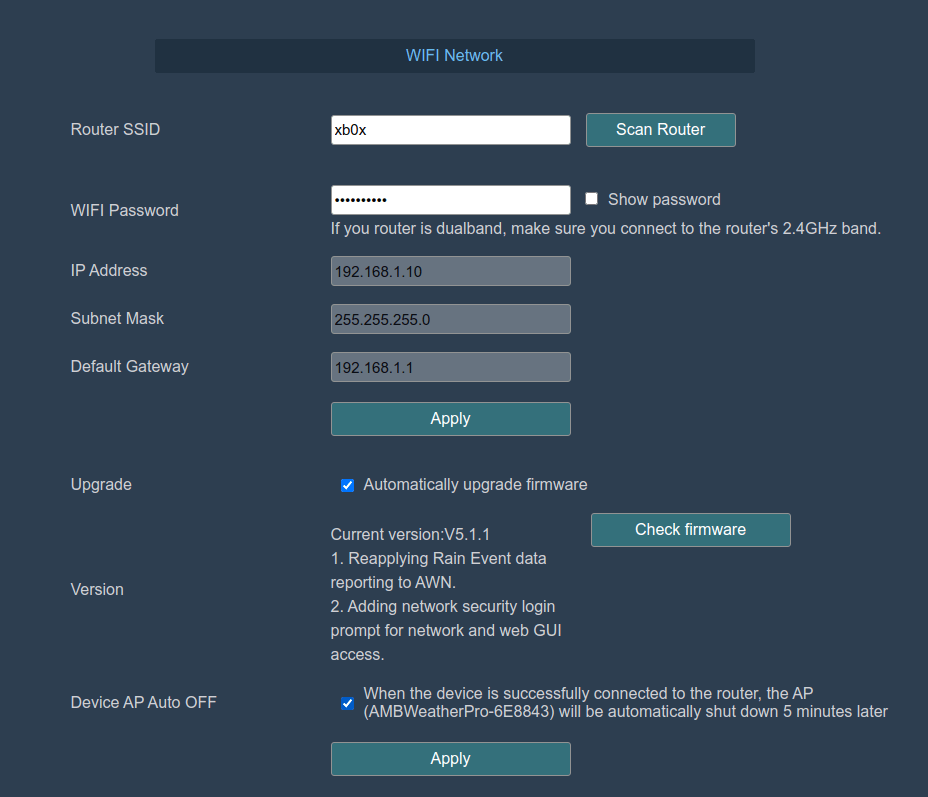
Once connected to the Internet - I could head to ambientweather.net and set my device to build my own extremely local weather dashboard.
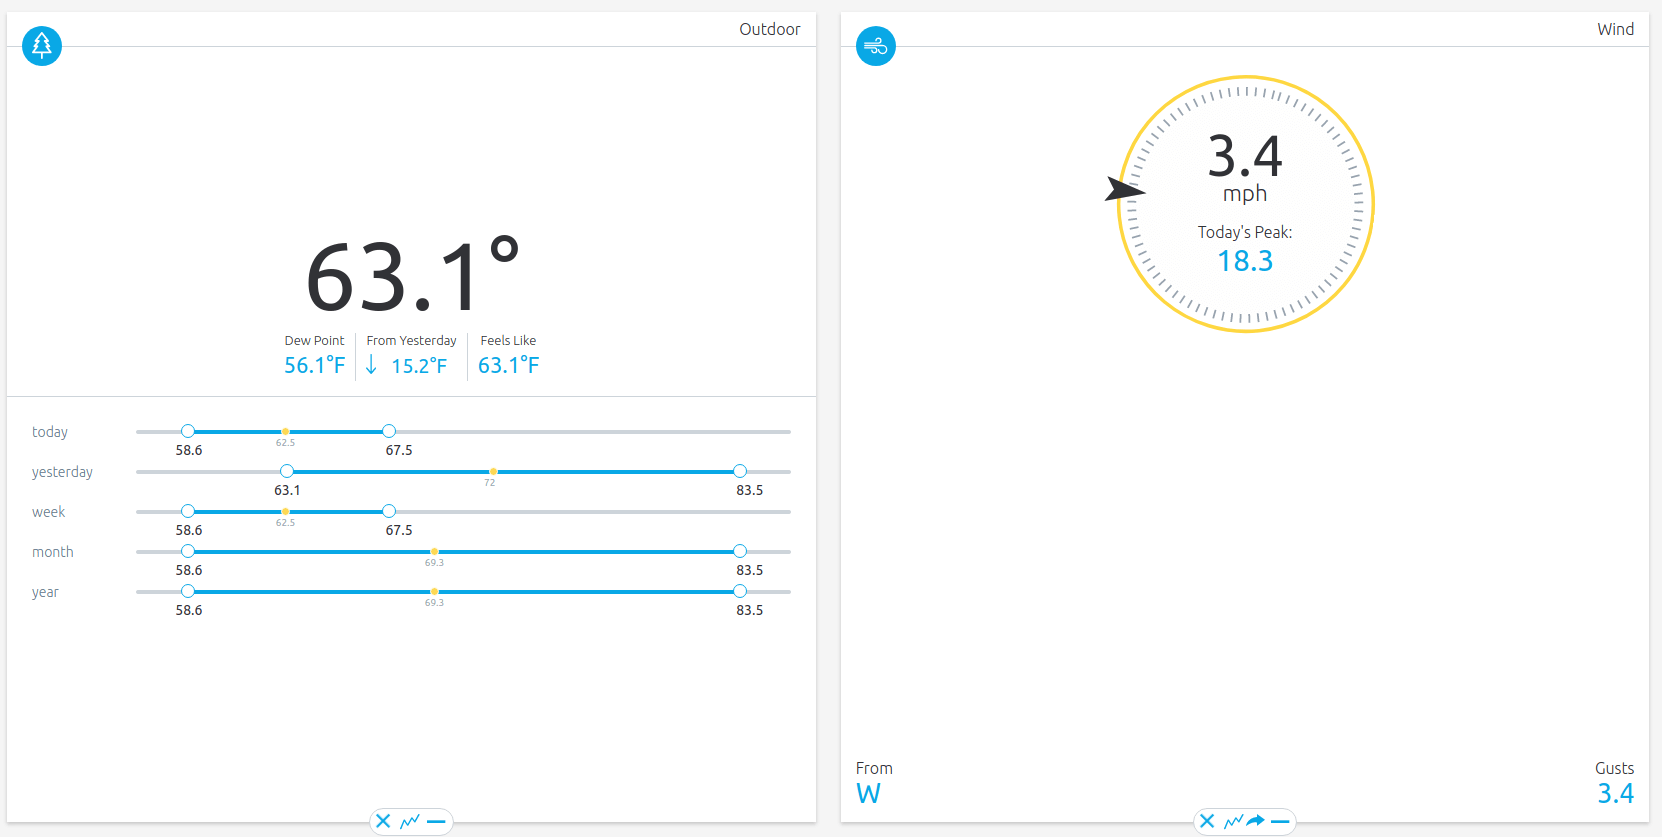
A few button clicks and the dashboard was up with a widget for:
- Temperature (Dew Point / Feels Like)
- Wind Speed & Direction
- Rain rate
- Pressure
- Humidity
- UV Index
- Solar Radiation
- Battery value
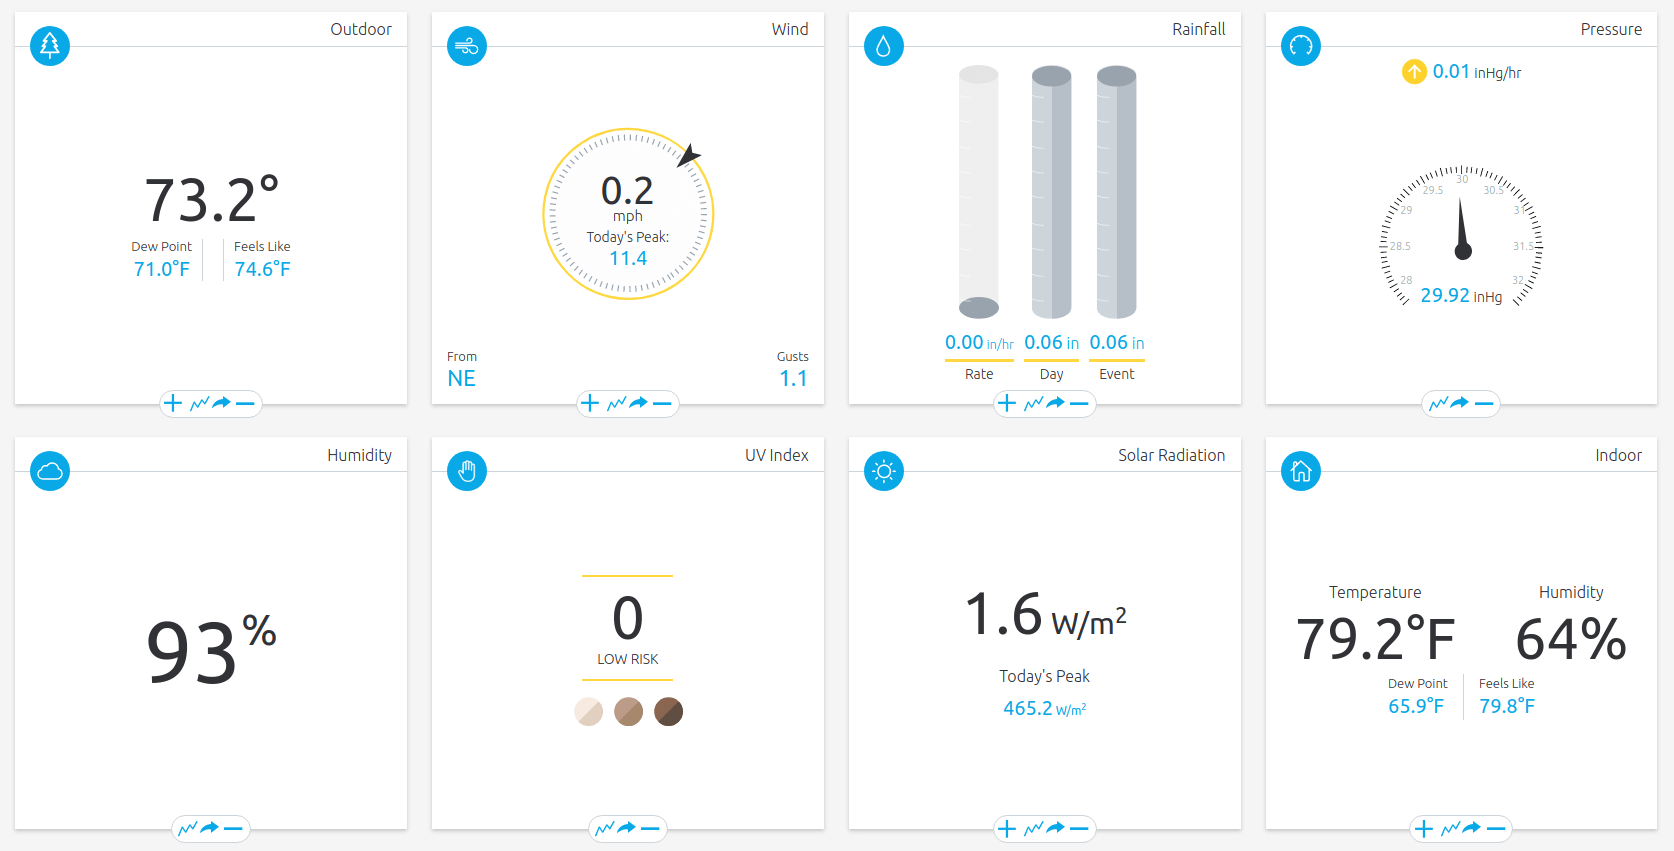
This was pretty nifty to see and even cooler once I realized these were stats gathered 10 steps from where I'm writing this blog. So now when its raining at the office and I'm wondering whats going on at home - this will keep track of the rain amount at my exact place.
I've also now started to truly understand what happens when the sun comes up and goes down. How much truly settles down when the light disappears. Temperature and wind are two of the stats that become so interesting to correlate with the time of night.
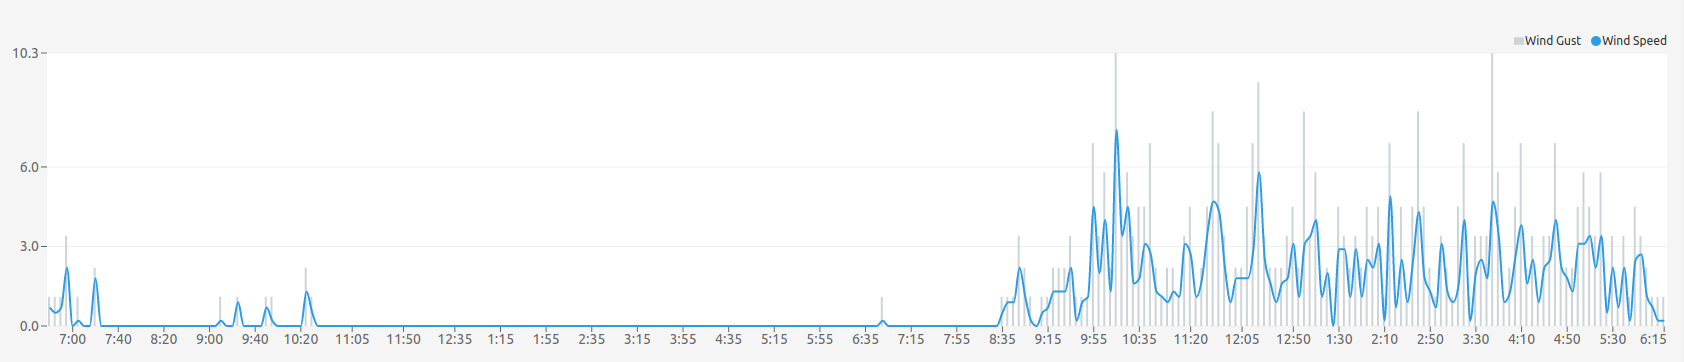
Now one day is hardly enough to draw a conclusion, but it does help bring meaning to the phrase - the dead of night. For February 11, this was 4:05am when the temperature was the lowest (62f) and wind at 0 mph. When I checked this page the next day it had grown with further analytics.
I'm guessing after a year I'll have quite a pile of data to draw conclusions with. Just two days of data and its already comparing to yesterday and proving ranges of the collected values.
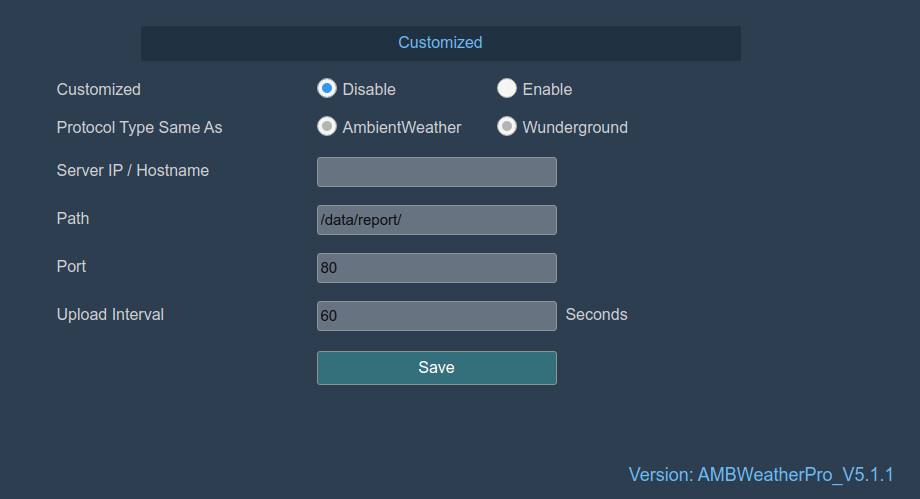
What I'm trying to figure out now is the best method to ingest this collected data into Prometheus. With a quick Google search I can find two different exporters that work using the Ambient Weather API.
Since I'm not 100% familiar with Prometheus and exporters yet - I still need to investigate why I can't just keep this local and use the built in data stream to emit to some endpoint that Prometheus can consume.
All of this investigation will have to wait until the Prometheus software is set up on a new Pi. Until then, I'll just keep looking at weather stats localized to my address.