Pi-hole: 19 months later
In mid 2017 I installed Pi-hole into my network on a Raspberry Pi and routed all my internet traffic through it. Today is now June 30, 2019 and I've been running it the entire time. Since this is installed directly in front of my router, all devices on my network including phones, cameras, laptops, game consoles and all benefit from the software.
A lot of features have been added since my last post, so we will briefly cover them:
- 4.0 - FTLDNS - Basically a forked dnsmasq with changes.
- 4.1 - Cache & Server information
- 4.2 - Blocking modes & Shared Memory
- 4.3 - Network Information table
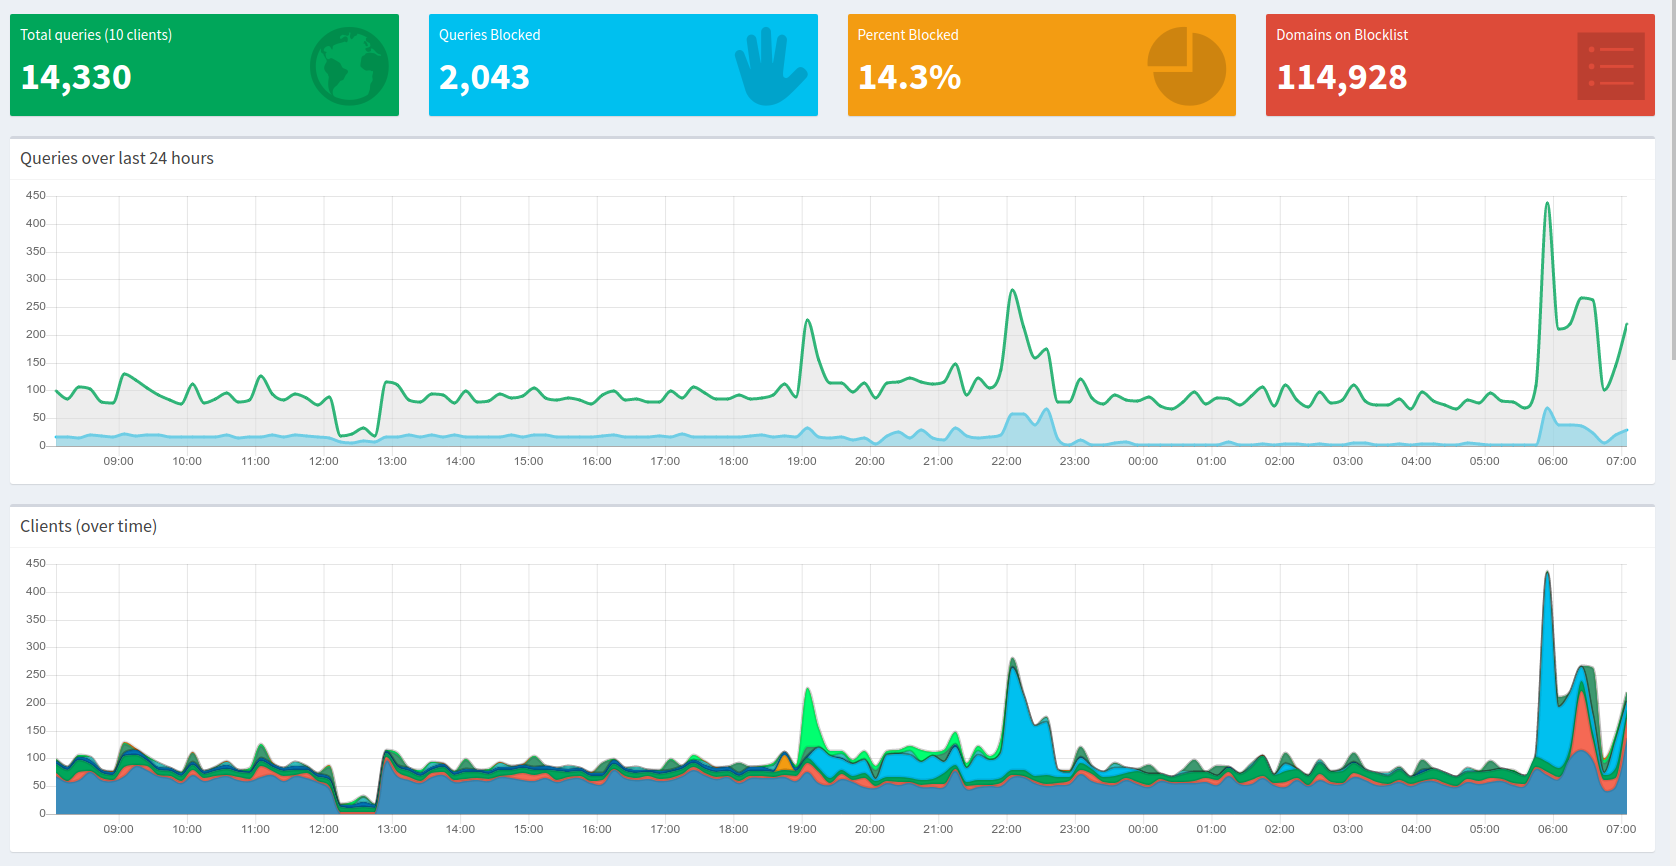
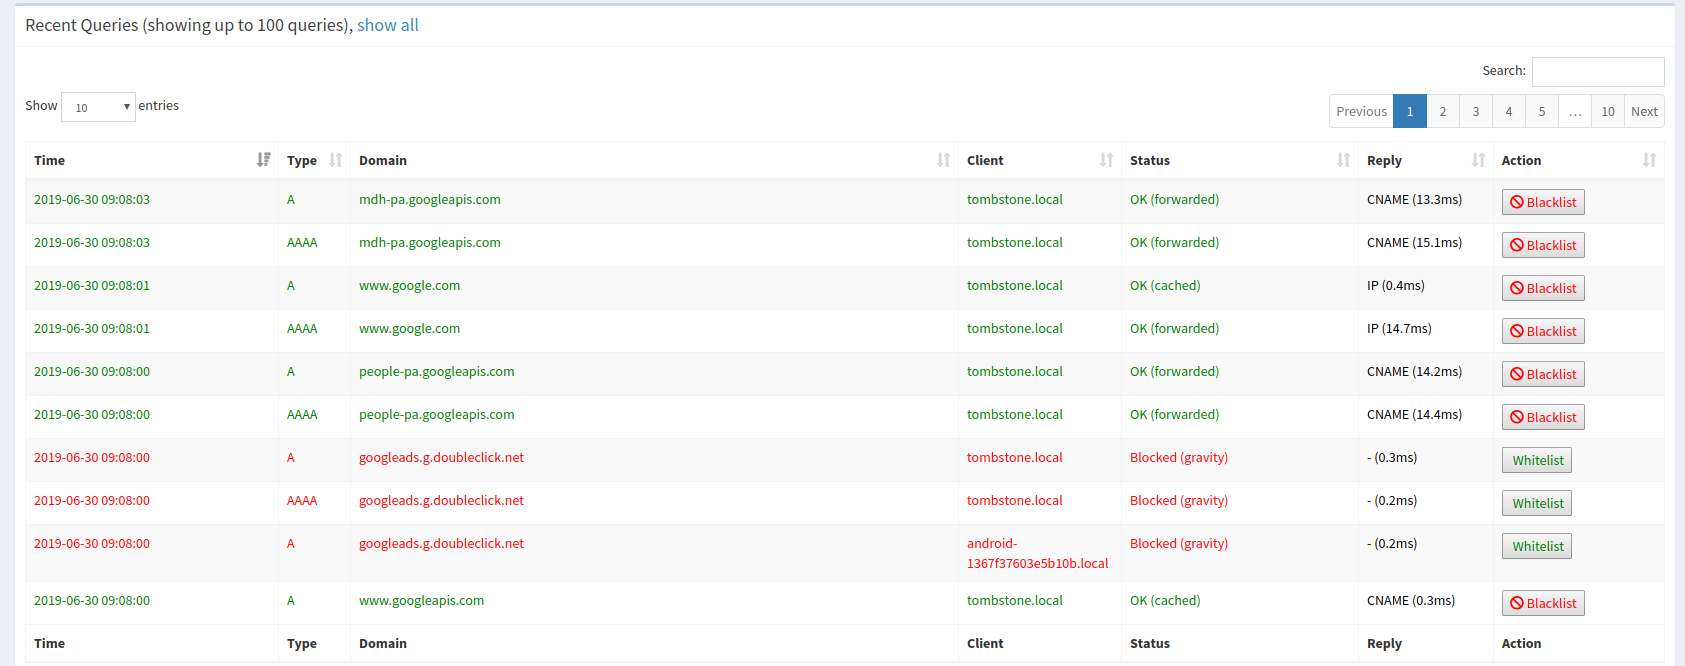
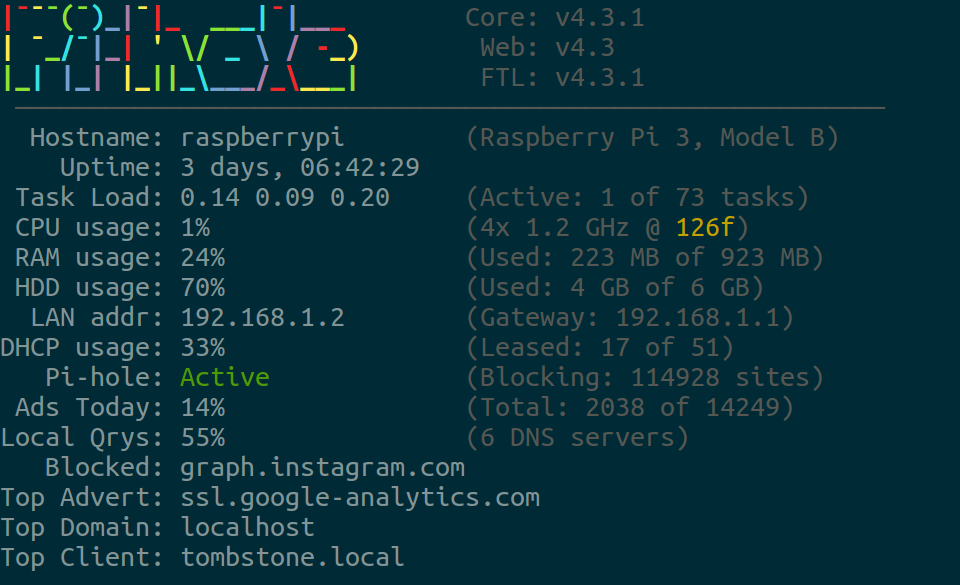
If we take a look at my dashboard above, we see a few things:
- Sleeping & work keeps the graph relatively quiet
- Rebooting your router/modem/pi-hole is destructive
- Turning on your phone in the morning spikes the graph hard
What I'm more interested in is pulling the sqlite database file and doing some analytics. I have a 710.2 MB file with the first request dated September 28, 2017 and last date being June 30, 2019.
Eagle eyed readers will note my previous blog about these analytics started earlier than September 28, 2017. Unfortunately I didn't realize the database purged itself of records older than a year. It took me a few months to notice, so I lost the data from June to September in 2017.
Between these dates we find 579 days or 833,760 minutes. Between that time, we have recorded 9,760,005 requests. Some simple math puts that at 11.7 requests a minute. So wow - my home network is busy.
First off, I want to figure out what domains my systems hit the most. With 19 months of data, we are bound to find a good list of frequently hit domains. So here are the top 13 requested domains.
| Domain | Count (allowed) |
|---|---|
| localhost | 1,587,626 |
| b.canaryis.com | 675,921 |
| clients4.google.com | 350,605 |
| play.google.com | 308,702 |
| i.canaryis.com | 181,002 |
| ssl.gstatic.com | 179,409 |
| clients6.google.com | 123,544 |
| wpad.local | 105,164 |
| api-global.netflix.com | 103,379 |
| www.googleapis.com | 87,924 |
| safebrowsing.googleapis.com | 82,977 |
| clientservices.googleapis.com | 78,155 |
| beacons.gcp.gvt2.com | 70,674 |
There are some things to talk about with this list. First off, why do I have 1.5 million requests for localhost? Easy. All the Laravel projects I work for development listen on localhost. I guess I program - a lot.
Next up is the combined almost 1 million requests for Canary, which is my security/home-health system. Not sure why it needs that many, but I'll dig into that later.
Finally, we have "wpad.local" & "beacons.gcp.gvt2.com". What are those? The first seems to be the "Web Proxy Auto-Discovery Protocol" of Windows 10. I'm a bit alarmed, because the Internet has click-bait titles like - "Disable WPAD now or have your accounts and private data compromised". However, it seems okay with a bit of an investigation.
Next up is the beacons domain, which seems to be owned by Google and related to Chrome updates. I do run Chrome, normally 10-20 tabs open on every computer. Perhaps this is related, but otherwise the list of domains is pretty consistent with my internet usage.
Below is the query I used in sqlite to generate the above list.
SELECT DOMAIN, count(DOMAIN)
FROM queries
WHERE (STATUS == 2 OR STATUS == 3)
GROUP BY DOMAIN
ORDER BY count(DOMAIN) DESC
LIMIT 15Moving on though, we are more interested in what the Pi-hole has actually blocked.
| Domain | Count (blocked) |
|---|---|
| ssl.google-analytics.com | 307,864 |
| watson.telemetry.microsoft.com | 253,549 |
| graph.accountkit.com | 151,263 |
| e.crashlytics.com | 120,996 |
| settings-win.data.microsoft.com | 109,639 |
| secure-dcr.imrworldwide.com | 78,896 |
| reports.crashlytics.com | 64,326 |
| analytics.localytics.com | 57,114 |
| wpad.local | 56,538 |
| graph.instagram.com | 54,875 |
| api.mixpanel.com | 47,647 |
| mobile.pipe.aria.microsoft.com | 47,045 |
| app-measurement.com | 44,163 |
So what is interesting is "wpad.local" is both a blocked and allowed domain. Did it become blocked later on? Did it become unblocked? I queried my system and it indeed was not blocked.
[i] No exact results found for wpad.local within the block lists
So perhaps the blocking was too aggressive and blocking a legitimate feature so it became unblocked.
A strange domain that I didn't recognize was - "secure-dcr.imrworldwide.com" and a quick Google search shows that the domain is owned by Nielsen who tracked TV habits. However, it seems to be connected to the ESPN Android application used for Fantasy leagues. Since I'm in between seasons - I uninstalled it. It thankfully is being blocked, but I don't need an application sending almost 100,000 requests to some analytical database.
Below is the query I used to generate the above list.
SELECT DOMAIN, count(DOMAIN)
FROM queries
WHERE (STATUS == 1
       OR STATUS == 4
       OR STATUS == 5
       OR STATUS == 6
       OR STATUS == 7
       OR STATUS = 8)
GROUP BY DOMAIN
ORDER BY count(DOMAIN) DESC
LIMIT 15Pi-hole is an interesting piece of software, so I tossed them a donation for blocking 1,339,468 requests for me. The features keep getting better, so I'll do another post in a year or so with even more analytics.