Pi-hole: 5 years later
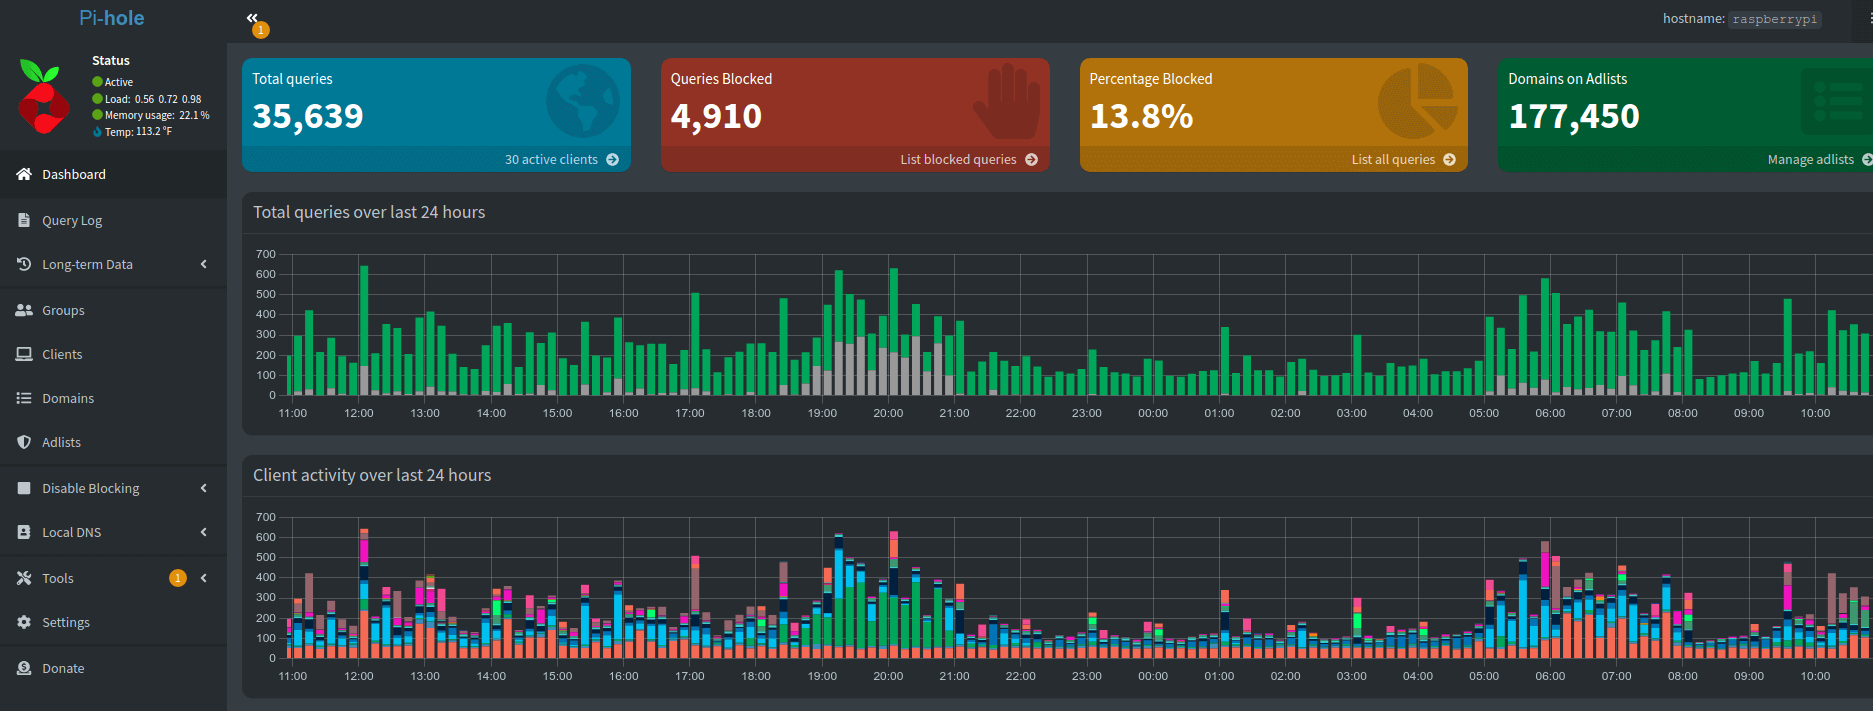
In 2017 I installed a Pi-hole into my network and routed all my DNS traffic through it. Today is now February 26, 2023 and I've been running it ever since.
This last year was the hardest of running Pi-hole in the history of this little project. It all started when one regular upgrade went south and it refused to complete. It turned out that running Raspberry Pi OS (Stretch) was no longer supported.
1041 upgraded, 735 newly installed, 11 to remove and 0 not upgraded.
Need to get 1,322 MB of archives.
After this operation, 2,179 MB of additional disk space will be used.
Do you want to continue? [Y/n] y
Stretch to Buster
I took a risky jump and did a in-place upgrade from Stretch to Buster to Bullseye. So now that I was up to date on my operating system I could resume my upgrades on the Pi-hole. Once done I completed the upgrades from Pi-hole 5.11 to 5.18:
- 5.12 - Add rate limit support and log flushing changes.
- 5.13 - Fixes for IPv6 and UI refactor for group assignment.
- 5.14 - Remove Debian Stretch support, UI refresh, 404 handler changes.
- 5.15 - Remove Ubuntu 18 support and improve deep CNAME inspection.
- 5.16 - Optimize long-term data graphs and remove heavy corn job.
- 5.17 - Upgrade to latest dnsmasq and fixes for static IP usage.
- 5.18 - Native systemd support and lighttpd upgrades.
A cool part of this upgrade was the introduction of PADD which was the upgraded version of the Chronometer2.
This is a pretty nifty feature compared to the previous - a great quick command to get quick insight on the status of the Pi.
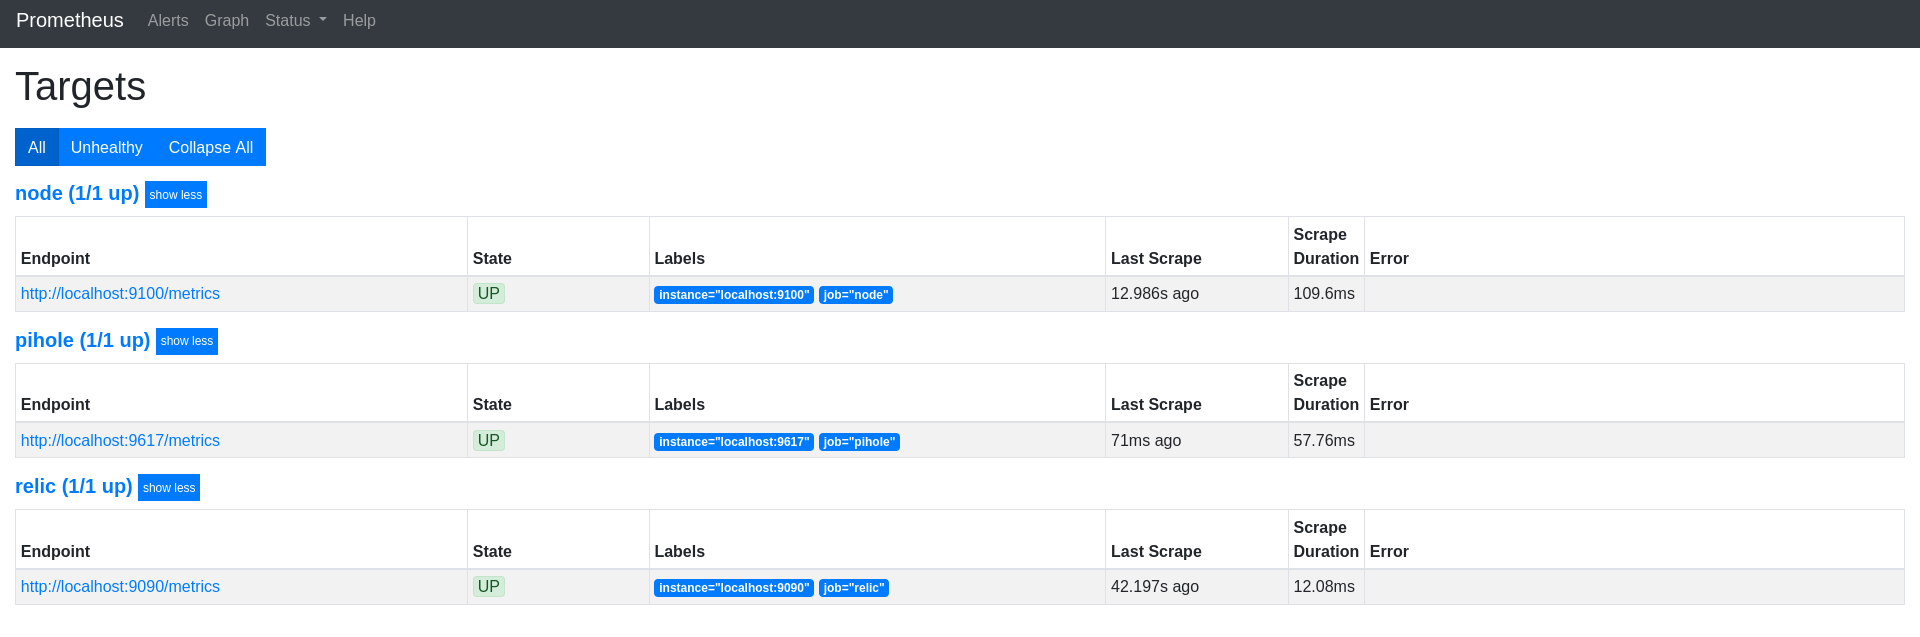
During the last year I also gained a Prometheus and Grafana server in my local network. So I dug into how to push Pi-hole data into that project in order to add Pi-hole data into my dashboards. I found a simple exporter and with that my Prometheus server was gathering the data.
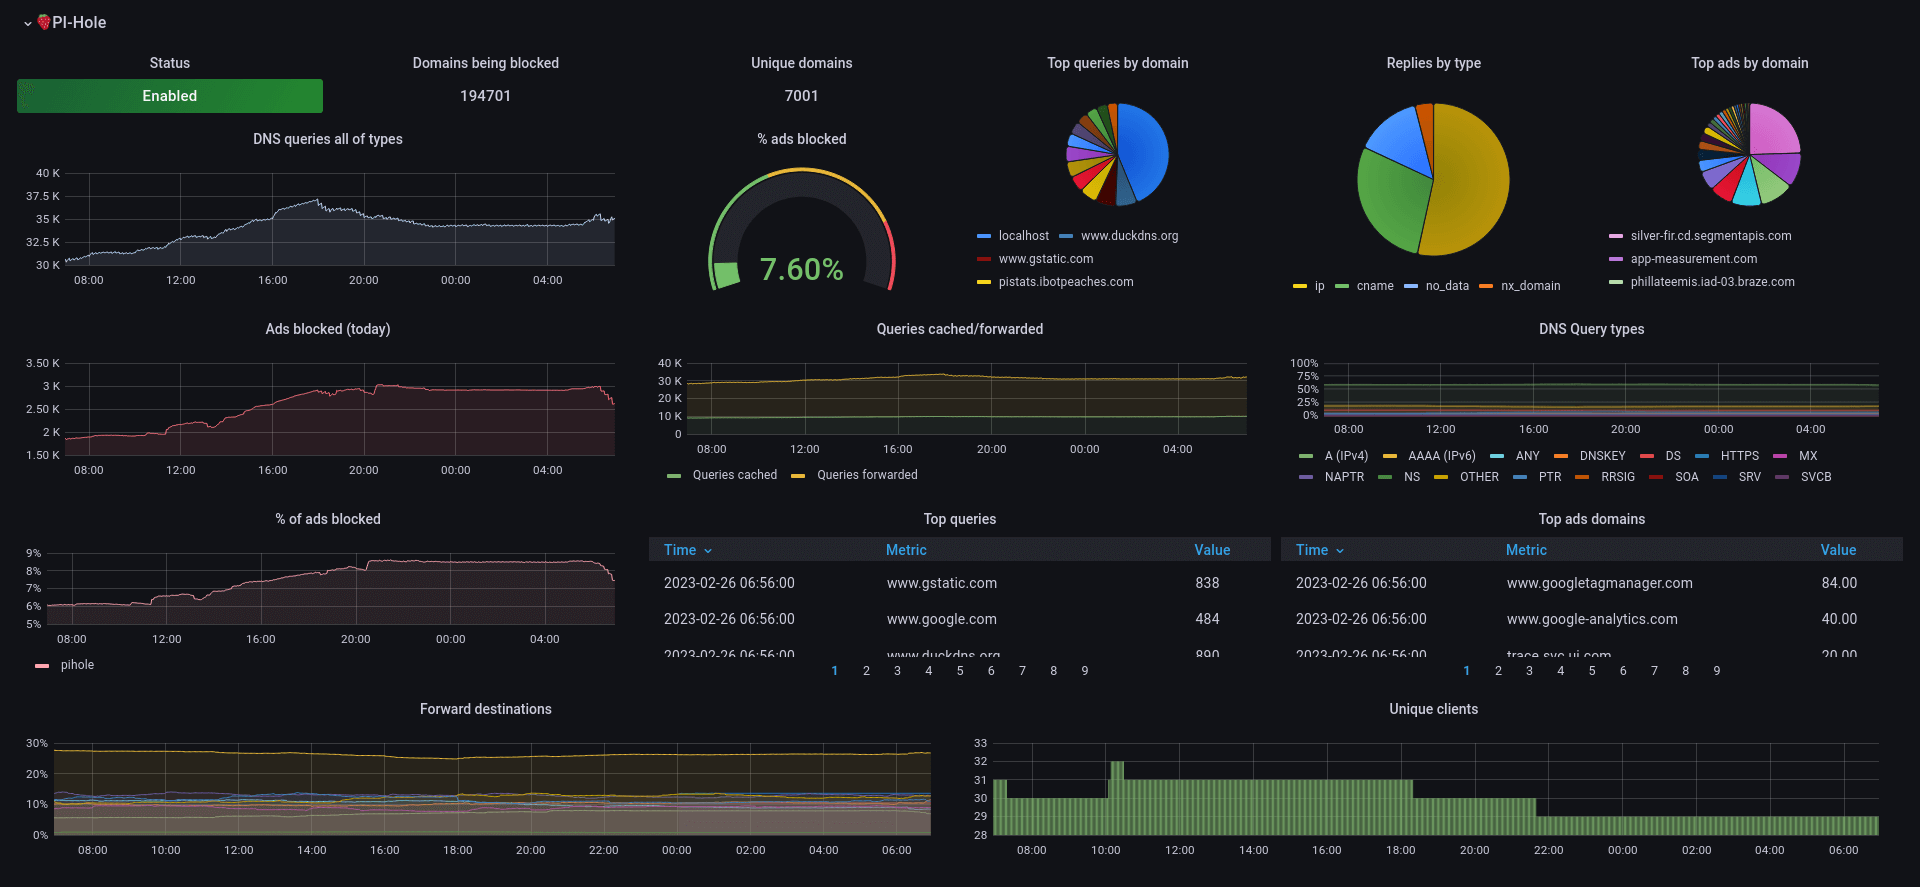
So then I found a Grafana dashboard and did a bit of configuring and had a new dashboard to contend with. The purpose here isn't really to replace the existing Pi-hole dashboard, but to use the available data to slowly build my own personal dashboard of all home data available.
So now all my new bells and whistles were up and running - it was time to do some data exports and see how the blocked/allowed queries were handling.
So I jumped onto my internal "pi-stats" project and executed php artisan stats:dump and waited. With over 40 million records its showing how inefficient some of these queries are I produced.
The script took ~90 minutes, but then dumped out the following stats:
Total Queries: 41,676,108
First Query: 2019-06-17 00:55:35
Last Query: 2023-01-28 21:19:47
Time in days: 1321
Time taken: 90 minute(s).
Top 15 Allowed
| Domain | Count |
| e7bf16b0-65ae-2f4e-0a6a-bcbe7b543c73.local | 5,631,937 |
| 68c40e5d-4310-def5-a1c3-20640e1cd583.local | 5,305,150 |
| 1d95ffae-4388-9fbc-1646-b2b637cecb64.local | 4,898,205 |
| localhost | 3,643,663 |
| 806c4c48-1715-4220-054f-909f83563938.local | 1,342,386 |
| b.canaryis.com | 1,111,227 |
| pistats.ibotpeaches.com | 588,559 |
| api-global.netflix.com | 376,154 |
| clients4.google.com | 361,808 |
| ssl.gstatic.com | 328,905 |
| cdn-0.nflximg.com | 322,484 |
| nrdp.prod.ftl.netflix.com | 319,364 |
| play.google.com | 312,519 |
| www.google.com | 280,645 |
| ichnaea.netflix.com | 279,543 |
Top 15 Blocked
| Domain | Count |
| 806c4c48-1715-4220-054f-909f83563938.local | 803,900 |
| e7bf16b0-65ae-2f4e-0a6a-bcbe7b543c73.local | 638,460 |
| 1d95ffae-4388-9fbc-1646-b2b637cecb64.local | 432,008 |
| ssl.google-analytics.com | 379,597 |
| 68c40e5d-4310-def5-a1c3-20640e1cd583.local | 247,892 |
| app-measurement.com | 246,464 |
| watson.telemetry.microsoft.com | 217,743 |
| googleads.g.doubleclick.net | 87,587 |
| settings-win.data.microsoft.com | 71,150 |
| www.googleadservices.com | 62,735 |
| mobile.pipe.aria.microsoft.com | 47,406 |
| sb.scorecardresearch.com | 47,058 |
| sessions.bugsnag.com | 44,110 |
| reports.crashlytics.com | 39,801 |
| secure-dcr.imrworldwide.com | 36,591 |
So lets take a look at the top few on both sides. The random UUID domains are still here and might take years to be bounced out of the top 15. If you remember these were from the multicast behavior added in Big Sur, which caused tons of requests to be made to any .local domain. Why they wouldn't stop if the other device(s) didn't respond properly after the first 100,000 requests - I don't know.
I renamed the devices to end in .pihole and that has halted Mac from reaching out to them nonstop. However, even 2 years since that fix - those requests are still leading both the blocked and unblocked. My network does look extremely different than prior with the introduction of a switch and a firewall. I blogged about this new setup prior, which may explain some of the new differences in my top 15 blocked and allowed domains.
The top blocked domains still fit into categories of:
- analytics
- bug tracking / analytics
- ads
- dumb Mac multicast spamming
The top allowed domains are:
- Canary security system
- Pi Stats (this internal stat project)
- Netflix
- Google Play
- dumb Mac multicast spamming
So I think in order to have a sane dataset - I should purge all these multicast domains from the history. It might save me 15~ million records and make this research a bit more interesting.
Pi-hole continues to evolve and be a great addition to my local network. I'll pass another donation and see them again in another year with another yearly blog post.