Grafana & Prometheus
A few weeks ago a Raspberry Pi I ordered quite awhile back showed up. This Pi was designated to be my new data collection Pi. The programs Prometheus and Grafana were new to me, but research showed these were the ones to use.
For those unaware - these programs pair quite well together. For a quick personal breakdown of features:
Prometheus
- Collection of metrics/data
- Robust querying of that data
- Compact storage of that data
- Alerting of that data
Grafana
- Visualization of collected data
- Reports of that collected data
- Insights of that collected data
- Custom dashboards of that collected data
So as you can imagine - I can collect data via Prometheus and Grafana perfectly can ingest that data to visualize it. The challenge I had was figuring out how all this worked.
When you configure Prometheus - it spawns a data collection service on the same instance it was configured on. This is a tool known as "Node exporter", which basically sits on a host machine and collects information and listens on a HTTP port to make that information known.
What is simple about this program is it doesn't transmit information anywhere as itself. It just puts information on a URL that another service is responsible for pulling. It doesn't store it, it doesn't do much outside of putting metrics on a page.
That page is a basic little text file with some comments to help the parser.
# HELP apt_autoremove_pending Apt package pending autoremove.
# TYPE apt_autoremove_pending gauge
apt_autoremove_pending 0
# HELP apt_upgrades_pending Apt package pending updates by origin.
# TYPE apt_upgrades_pending gauge
apt_upgrades_pending{arch="",origin=""} 0
# HELP go_gc_duration_seconds A summary of the pause duration of garbage collection cycles.
# TYPE go_gc_duration_seconds summary
go_gc_duration_seconds{quantile="0"} 9.6315e-05
go_gc_duration_seconds{quantile="0.25"} 0.000136203
go_gc_duration_seconds{quantile="0.5"} 0.000305369
go_gc_duration_seconds{quantile="0.75"} 0.000580848
go_gc_duration_seconds{quantile="1"} 0.003516581
go_gc_duration_seconds_sum 64.884547092
go_gc_duration_seconds_count 159728
// ....There is way more than just that, but you get the picture. Now that I have this endpoint showing data - I can tell Prometheus to read that file every so often and record that data. I keep most of my analytics at the 60 second refresh pull, which is very often and may prove to be more data than I want.
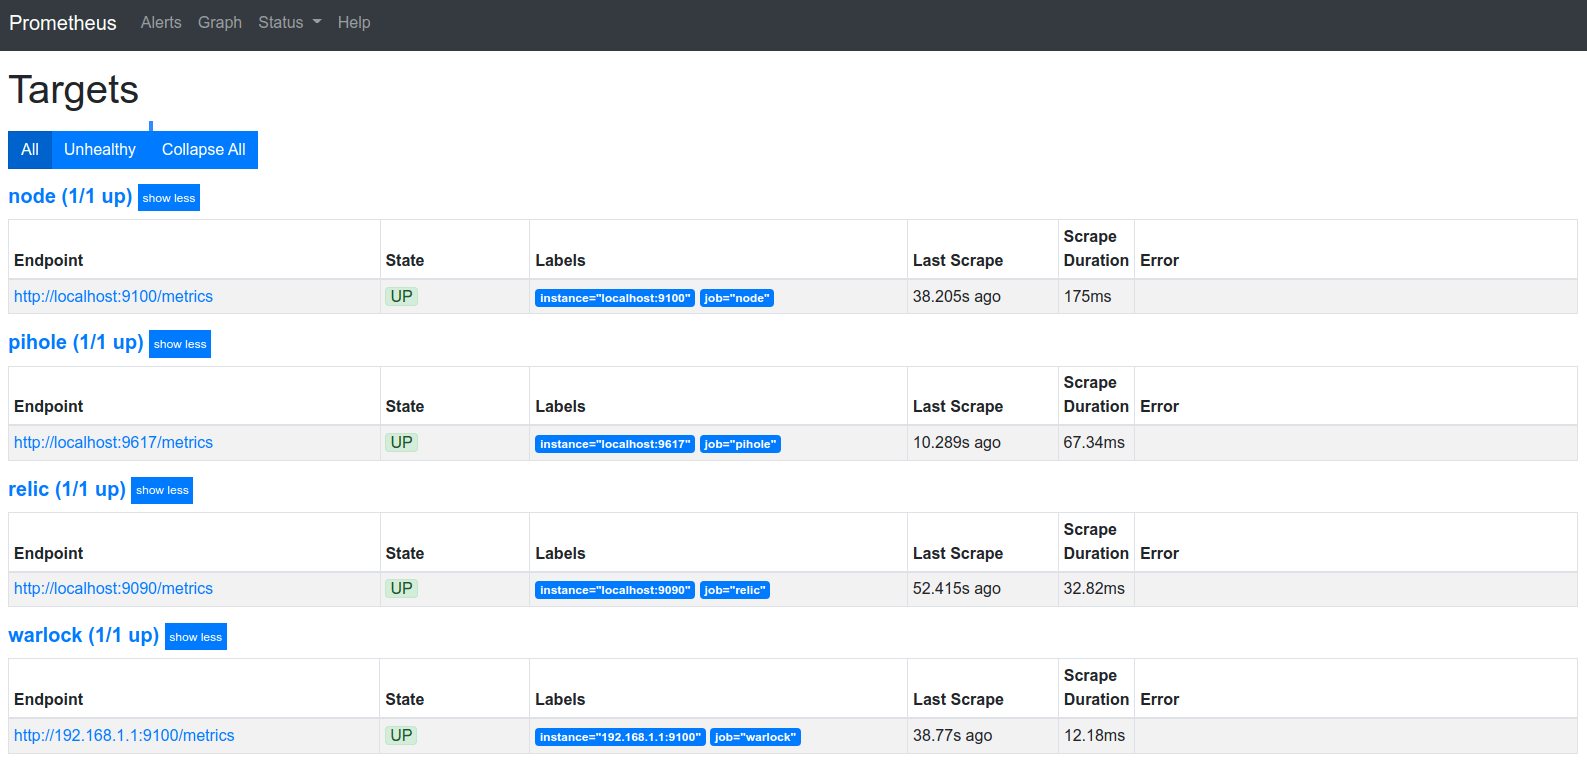
So for now since I'm still setting this up I only have a few things logged which are listed below:
- The device itself (twice)
- The Pi that handles Pi-hole
- The TLSense 8550U running OPNSense
I have two of the same right now because I'm still learning how to best configure these collection tools and want a test subject. I have in progress the following things once I perfect the timing and how I want to configure these exporters.
What I'm basically trying to do is log information about all my devices remote or local so I can build a custom dashboard for an immediate overview of everything I care about. This may be local weather with the up-time of my hobby projects in another widget. It may show my network speed from a random test it stored from the last hour. The possibilities are quite endless here once you have the data.
So once you have an exporter running and Prometheus configured to read that data stream - you now have a collection of metrics and you just need to visualize that data.
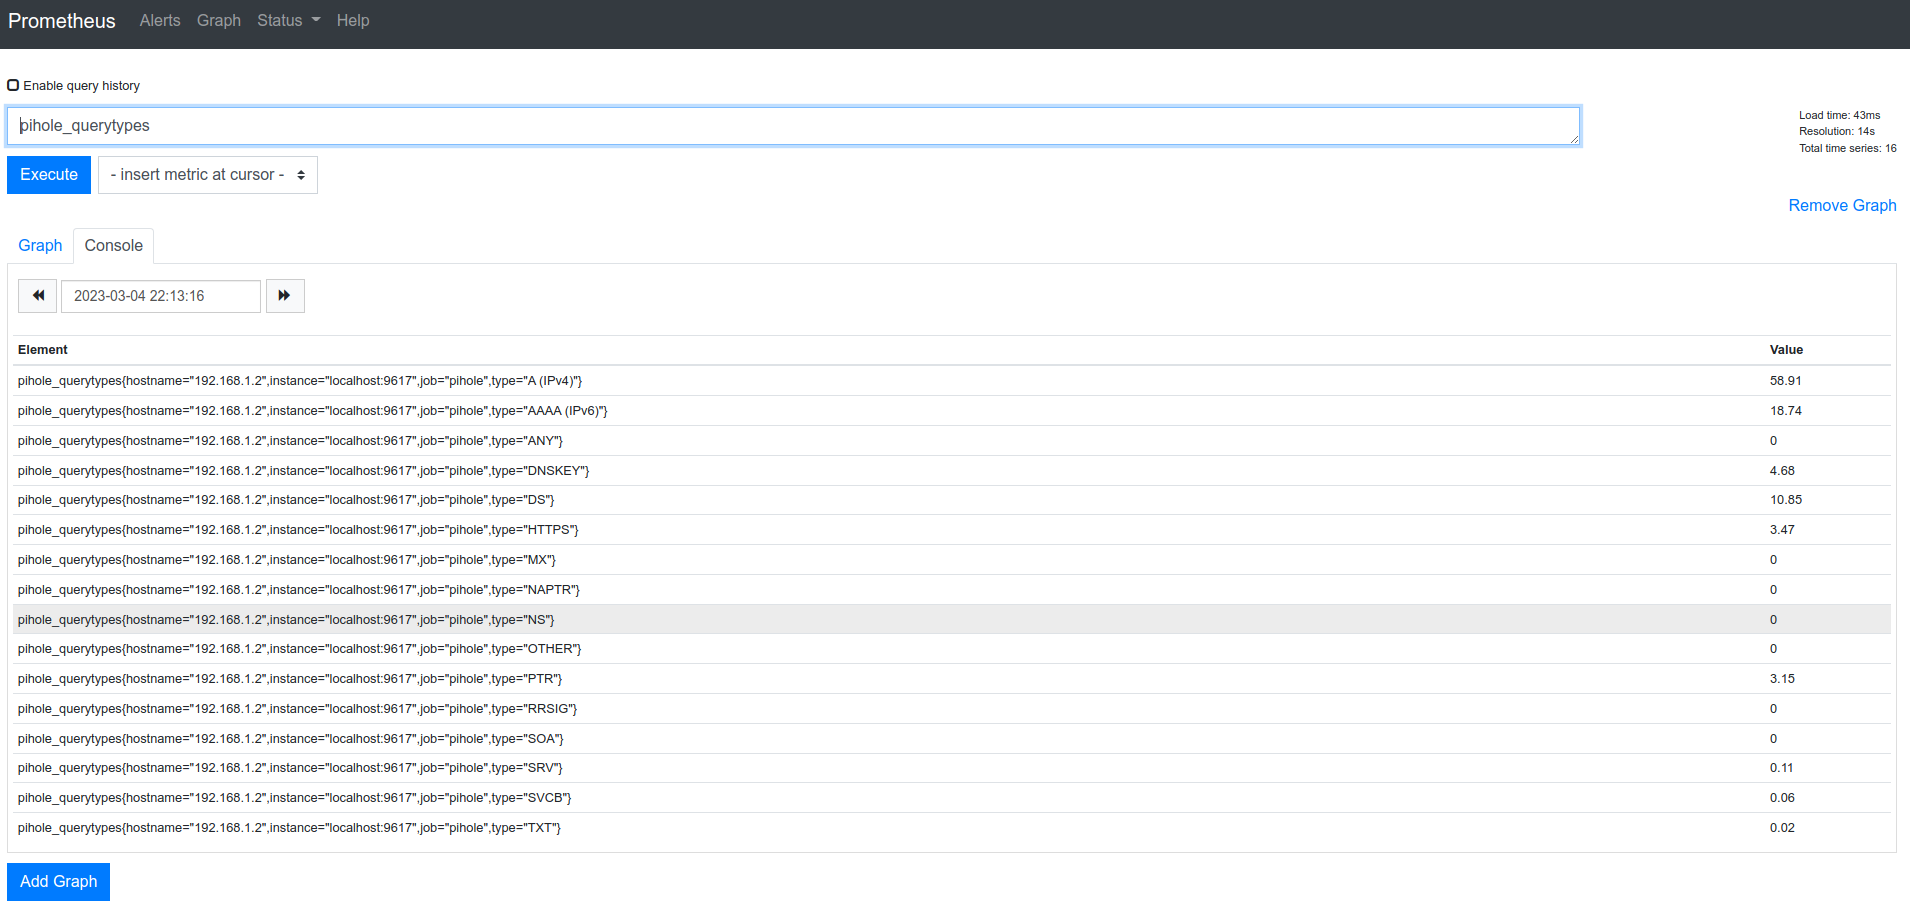
You can query data in Prometheus to check if the metrics you want are showing up as you expect. The above pictured metric is specific to my Pi-hole so I wouldn't expect multiple hosts reporting this value. However, once I have the last minute load percentage from all my Pi's - that would be a perfect graph to have.
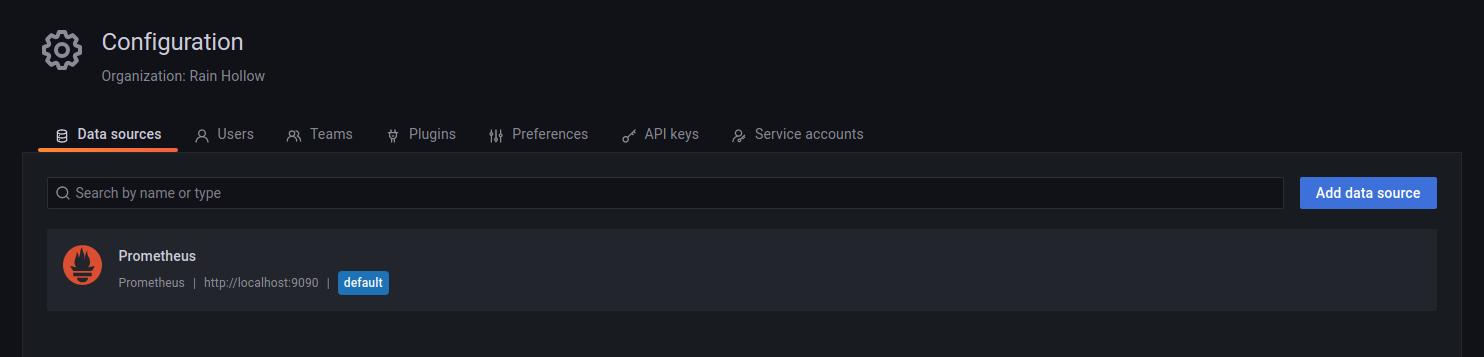
This is where Grafana comes in as you can select Prometheus as an incoming data source and it gains access to all of these metrics.
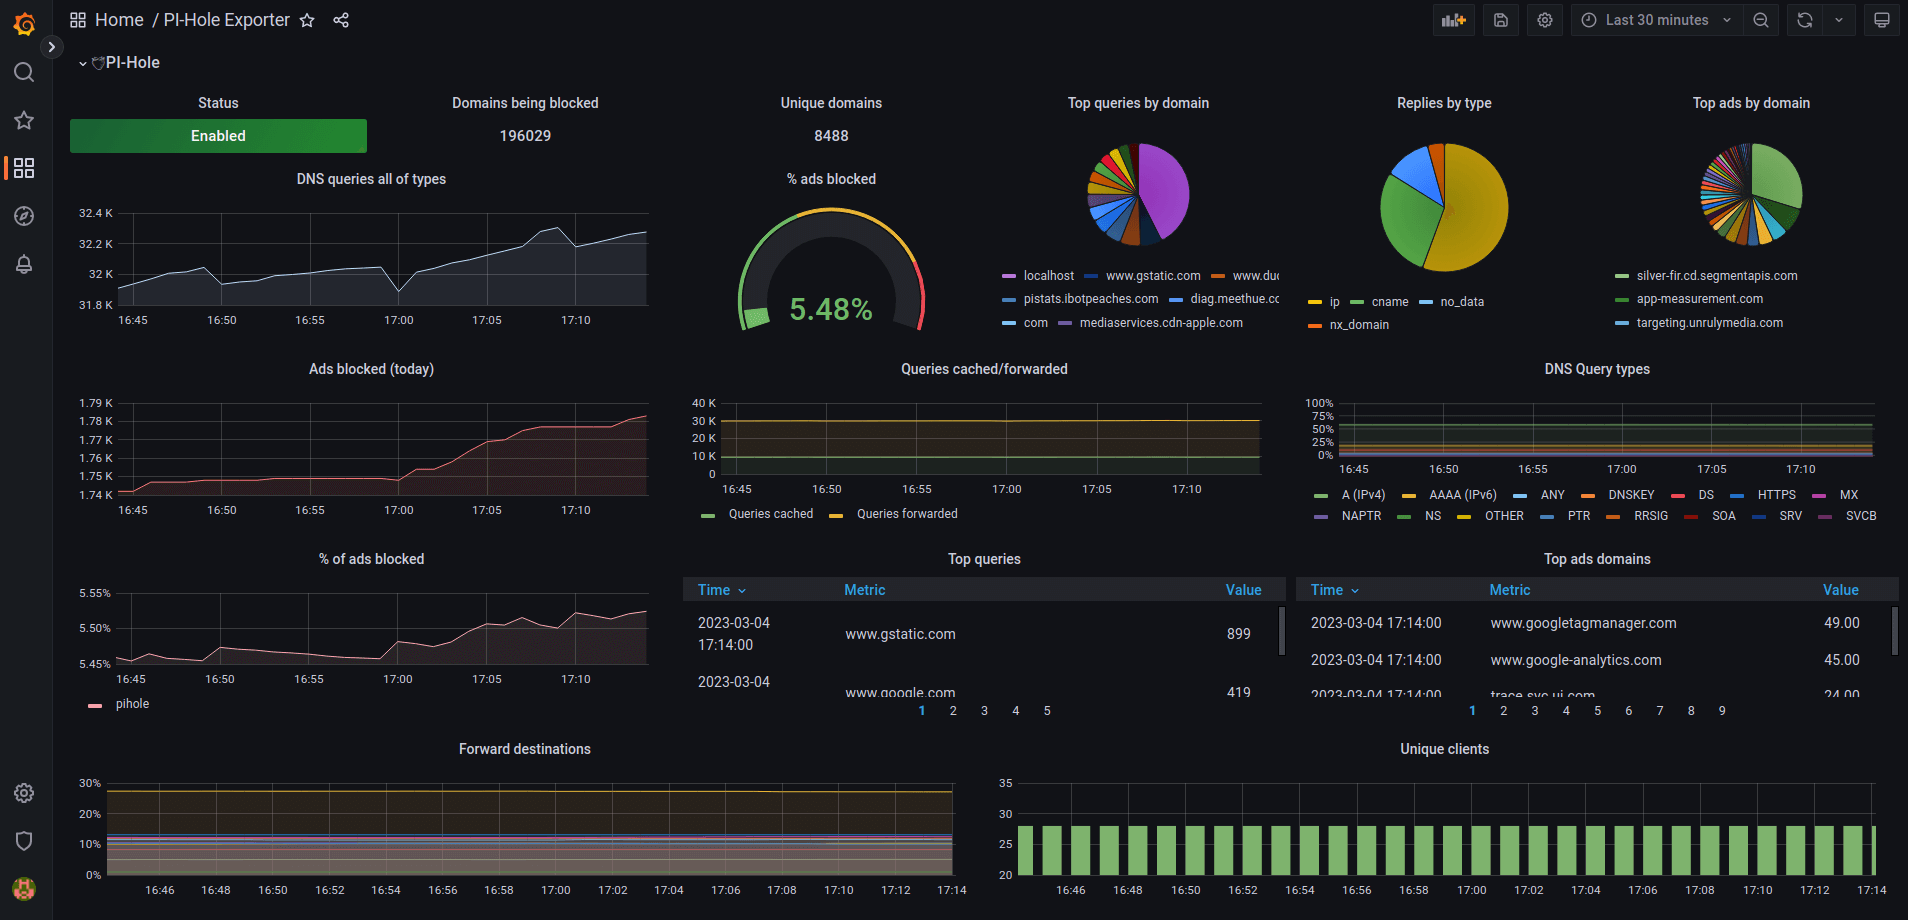
So now that Grafana has all the data available you have a few options here. You can find a dashboard that visualizes your collected data or build your own. What I prefer to do is find a dashboard even if its not compatible with the data source I'm using. This allows me to quickly learn from their example and adapt for my use-case.
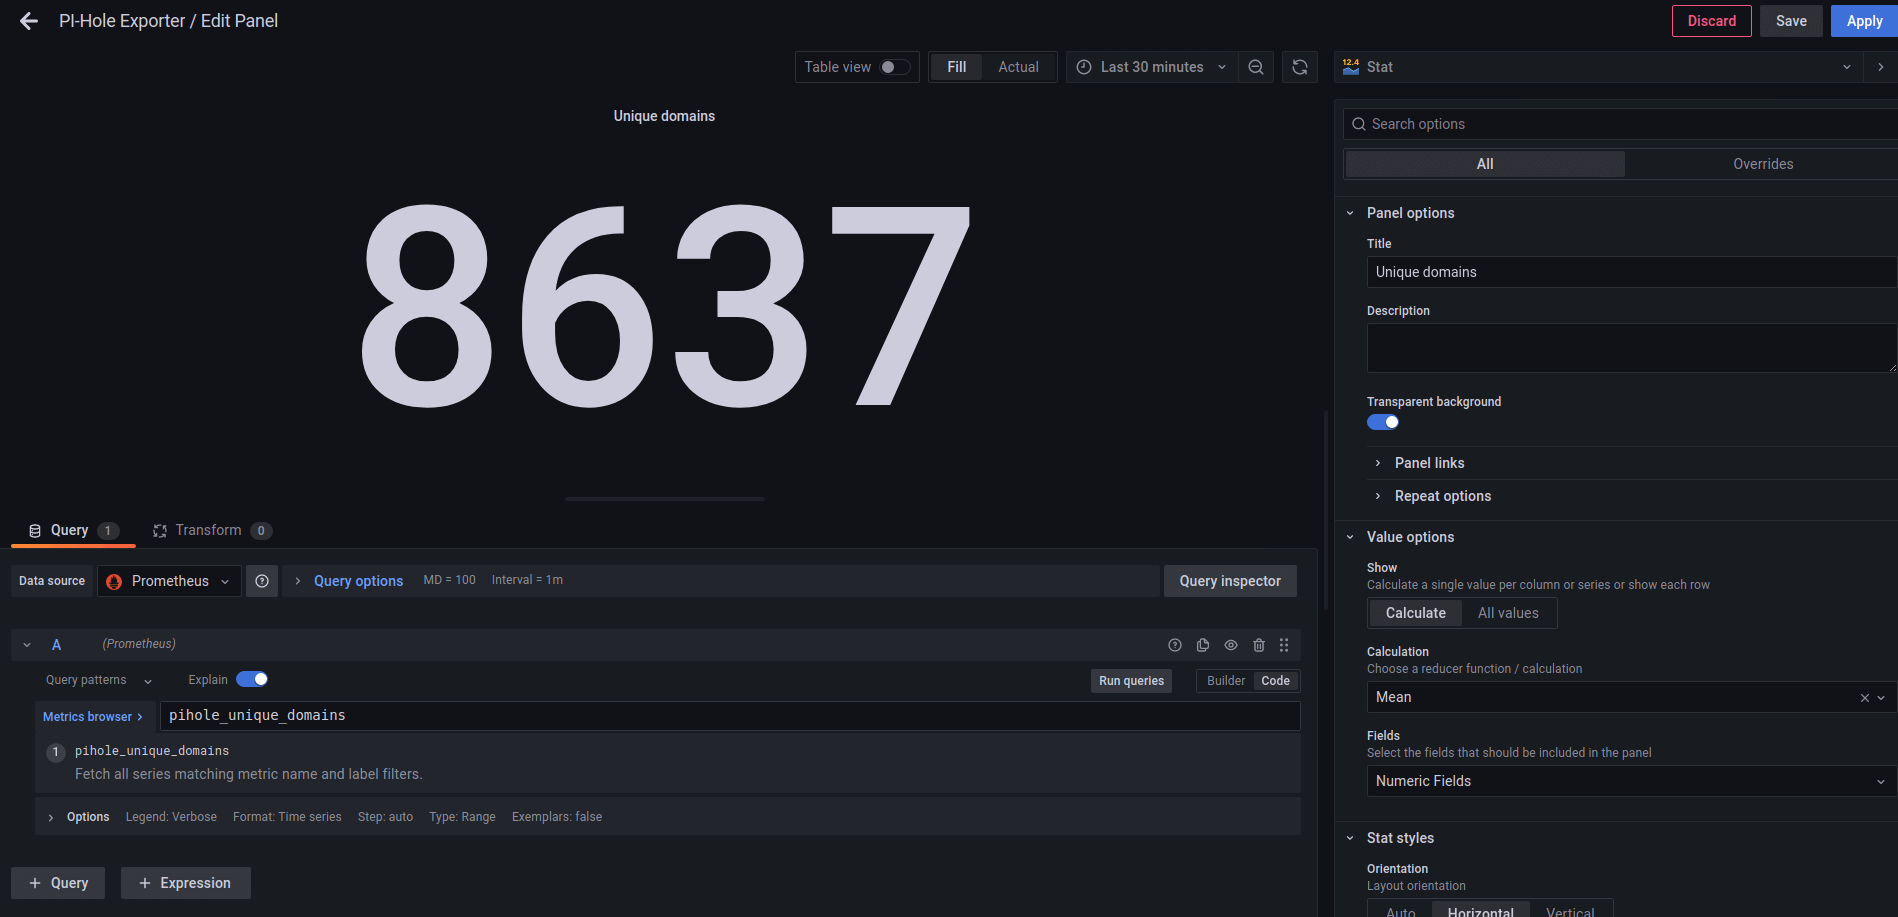
Take for example the Pi-hole dashboard in the beginning of this blog. I can chose to edit a singular widget of that dashboard and learn how it works. This is very helpful for me to quickly learn how the expressions and transformers work. This editor pictured above has some great typeahead support as well. It knows every metric and possibility of formatting on that data which helps you live visualize your widget.
So now I'm entering the phase of finishing this setup. I have many more things to obtain metrics from and a few new dashboards to complete. When this is done phase 3 of my home lab will be complete.